What is a Control Chart?
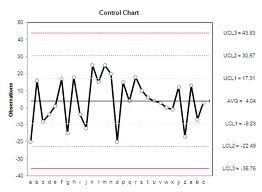
A control chart is a statistical tool used to distinguish between variation in a process
resulting from common causes and variation resulting from special causes. It
presents a graphic display of process stability or instability over time (Viewgraph 1).
Every process has variation. Some variation may be the result of causes which are
not normally present in the process. This could be special cause variation. Some
variation is simply the result of numerous, ever-present differences in the process.
This is common cause variation. Control Charts differentiate between these two
types of variation.
One goal of using a Control Chart is to achieve and maintain process stability.
Process stability is defined as a state in which a process has displayed a certain
degree of consistency in the past and is expected to continue to do so in the future.
This consistency is characterized by a stream of data falling within control limits
based on plus or minus 3 standard deviations (3 sigma) of the centerline [Ref.
6, p. 82]. We will discuss methods for calculating 3 sigma limits later in this module.
NOTE: Control limits represent the limits of variation that should be expected from
a process in a state of statistical control. When a process is in statistical control, any
variation is the result of common causes that effect the entire production in a similar
way. Control limits should not be confused with specification limits, which
represent the desired process performance.
Why should teams use Control Charts?
A stable process is one that is consistent over time with respect to the center and the
spread of the data. Control Charts help you monitor the behavior of your process to
determine whether it is stable. Like Run Charts, they display data in the time
sequence in which they occurred. However, Control Charts are more efficient
that Run Charts in assessing and achieving process stability.
Your team will benefit from using a Control Chart when you want to (Viewgraph 2)
- Monitor process variation over time.
- Differentiate between special cause and common cause variation.
- Assess the effectiveness of changes to improve a process.
- Communicate how a process performed during a specific period.


