Introduction to Remote Sensing
Introduction to Remote Sensing
Introduction Remote sensing can be defined as the collection of data about an object from a distance. Humans and many other types of animals accomplish this task with aid of eyes or by the sense of smell or hearing. Geographers use the technique of remote sensing to monitor or measure phenomena found in the Earth's
lithosphere,
biosphere,
hydrosphere, and
atmosphere. Remote sensing of the environment by geographers is usually done with the help of mechanical devices known as
remote sensors. These gadgets have a greatly improved ability to receive and record information about an object without any physical contact. Often, these sensors are positioned away from the object of interest by using helicopters, planes, and satellites. Most sensing devices record information about an object by measuring an object's transmission of
electromagnetic energy from
reflecting and
radiating surfaces. Remote sensing imagery has many applications in mapping land-use and cover, agriculture, soils mapping, forestry, city planning, archaeological investigations, military observation, and geomorphological surveying, among other uses. For example, foresters use aerial photographs for preparing forest cover maps, locating possible access roads, and measuring quantities of trees harvested. Specialized photography using color infrared film has also been used to detect disease and insect damage in forest trees. The simplest form of remote sensing uses photographic cameras to record information from
visible or
near infrared wavelengths (
Table 2e-1). In the late 1800s, cameras were positioned above the Earth's surface in balloons or kites to take
oblique aerial photographs of the landscape. During World War I,
aerial photography played an important role in gathering information about the position and movements of enemy troops. These photographs were often taken from airplanes. After the war, civilian use of aerial photography from airplanes began with the systematic
vertical imaging of large areas of Canada, the United States, and Europe. Many of these images were used to construct topographic and other types of
reference maps of the natural and human-made features found on the Earth's surface.
Table 2e-1: Major regions of the electromagnetic spectrum.
| Region Name |
Wavelength |
Comments |
| Gamma Ray |
< 0.03 nanometers |
Entirely absorbed by the Earth's atmosphere and not available for remote sensing. |
| X-ray |
0.03 to 30 nanometers |
Entirely absorbed by the Earth's atmosphere and not available for remote sensing. |
| Ultraviolet |
0.03 to 0.4 micrometers |
Wavelengths from 0.03 to 0.3 micrometers absorbed by ozone in the Earth's atmosphere. |
| Photographic Ultraviolet |
0.3 to 0.4 micrometers |
Available for remote sensing the Earth. Can be imaged with photographic film. |
| Visible |
0.4 to 0.7 micrometers |
Available for remote sensing the Earth. Can be imaged with photographic film. |
| Infrared |
0.7 to 100 micrometers |
Available for remote sensing the Earth. Can be imaged with photographic film. |
| Reflected Infrared |
0.7 to 3.0 micrometers |
Available for remote sensing the Earth. Near Infrared 0.7 to 0.9 micrometers. Can be imaged with photographic film. |
| Thermal Infrared |
3.0 to 14 micrometers
|
Available for remote sensing the Earth. This wavelength cannot be captured with photographic film. Instead, mechanical sensors are used to image this wavelength band. |
| Microwave or Radar |
0.1 to 100 centimeters |
Longer wavelengths of this band can pass through clouds, fog, and rain. Images using this band can be made with sensors that actively emit microwaves. |
| Radio |
> 100 centimeters |
Not normally used for remote sensing the Earth. |
The development of color photography following World War II gave a more natural depiction of surface objects. Color aerial photography also greatly increased the amount of information gathered from an object. The human eye can differentiate many more shades of color than tones of gray (
Figure 2e-1 and
2e-2). In 1942, Kodak developed color infrared film, which recorded wavelengths in the near-infrared part of the electromagnetic spectrum. This film type had good haze penetration and the ability to determine the type and health of vegetation.
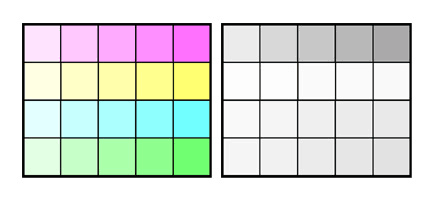
| Figure 2e-1: The rows of color tiles are replicated in the right as complementary gray tones. On the left, we can make out 18 to 20 different shades of color. On the right, only 7 shades of gray can be distinguished. |
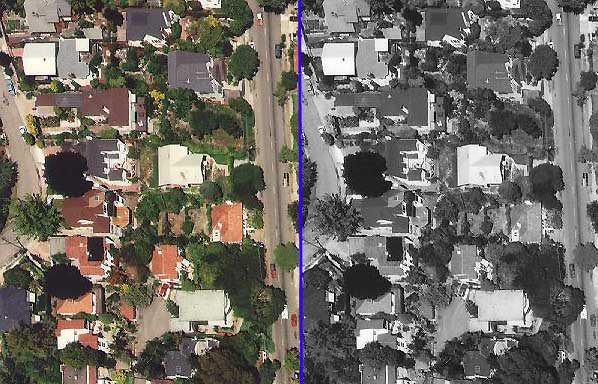
| Figure 2e-2: Comparison of black and white and color images of the same scene. Note how the increased number of tones found on the color image make the scene much easier to interpret. (Source: University of California at Berkley - Earth Sciences and Map Library). |
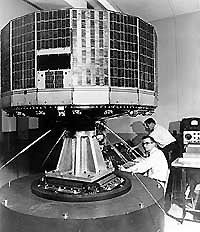
Satellite Remote Sensing In the 1960s, a revolution in remote sensing technology began with the deployment of space satellites. From their high vantage-point, satellites have a greatly extended view of the Earth's surface. The first meteorological satellite,
TIROS-1 (
Figure 2e-3), was launched by the United States using an Atlas rocket on April 1, 1960. This early weather satellite used vidicon cameras to scan wide areas of the Earth's surface. Early satellite remote sensors did not use conventional film to produce their images. Instead, the sensors digitally capture the images using a device similar to a television camera. Once captured, this data is then transmitted electronically to receiving stations found on the Earth's surface. The image below (
Figure 2e-4) is from TIROS-7 of a
mid-latitude cyclone off the coast of New Zealand.
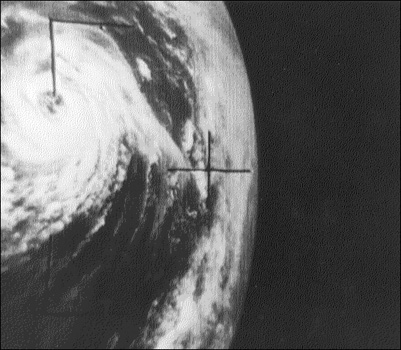
| Figure 2e-4: TIROS-7 image of a mid-latitude cyclone off the coast of New Zealand, August 24, 1964. (Source: NASA - Looking at Earth From Space). |
Today, the
GOES (Geostationary Operational Environmental Satellite) system of satellites provides most of the remotely sensed weather information for North America. To cover the complete continent and adjacent oceans two satellites are employed in a
geostationary orbit. The western half of North America and the eastern Pacific Ocean is monitored by GOES-10, which is directly above the equator and 135° West longitude. The eastern half of North America and the western Atlantic are cover by GOES-8. The GOES-8 satellite is located overhead of the equator and 75° West longitude. Advanced sensors aboard the GOES satellite produce a continuous data stream so images can be viewed at any instance. The imaging sensor produces visible and infrared images of the Earth's terrestrial surface and oceans (
Figure 2e-5). Infrared images can depict weather conditions even during the night. Another sensor aboard the satellite can determine vertical temperature profiles, vertical moisture profiles, total
precipitable water, and
atmospheric stability.
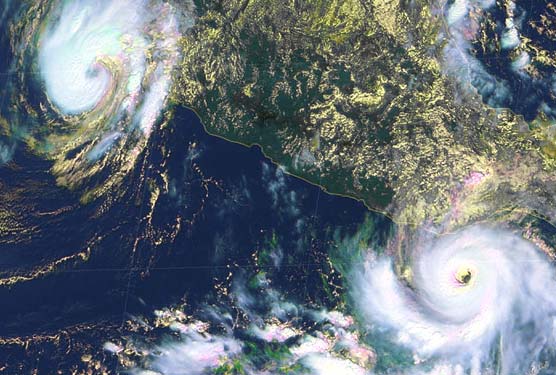
| Figure 2e-5: Color image from GOES-8 of hurricanes Madeline and Lester off the coast of Mexico, October 17, 1998. (Source: NASA - Looking at Earth From Space). |
In the 1970s, the second revolution in remote sensing technology began with the deployment of the
Landsat satellites. Since this 1972, several generations of Landsat satellites with their
Multispectral Scanners (
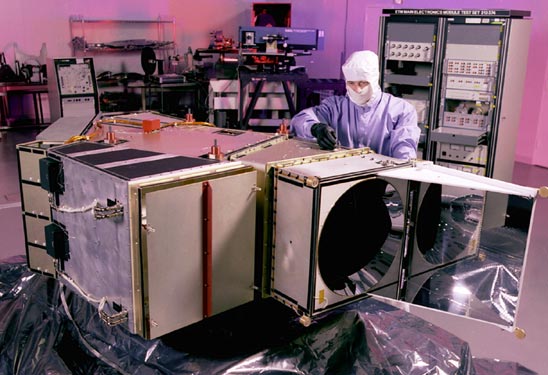
MSS) have been providing continuous coverage of the Earth for almost 30 years. Current, Landsat satellites orbit the Earth's surface at an altitude of approximately 700 kilometers. Spatial resolution of objects on the ground surface is 79 x 56 meters. Complete coverage of the globe requires 233 orbits and occurs every 16 days. The Multispectral Scanner records a zone of the Earth's surface that is 185 kilometers wide in four wavelength bands: band 4 at 0.5 to 0.6 micrometers, band 5 at 0.6 to 0.7 micrometers, band 6 at 0.7 to 0.8 micrometers, and band 7 at 0.8 to 1.1 micrometers. Bands 4 and 5 receive the green and red wavelengths in the visible light range of the electromagnetic spectrum. The last two bands image near-infrared wavelengths. A second sensing system was added to Landsat satellites launched after 1982. This imaging system, known as the
Thematic Mapper, records seven wavelength bands from the visible to far-infrared portions of the electromagnetic spectrum (
Figure 2e-6). In addition, the ground resolution of this sensor was enhanced to 30 x 20 meters. This modification allows for greatly improved clarity of imaged objects.
The usefulness of satellites for remote sensing has resulted in several other organizations launching their own devices. In France, the
SPOT (
Satellite Pour l'Observation de la Terre) satellite program has launched five satellites since 1986. Since 1986, SPOT satellites have produced more than 10 million images. SPOT satellites use two different sensing systems to image the planet. One sensing system produces black and white panchromatic images from the visible band (0.51 to 0.73 micrometers) with a ground resolution of 10 x 10 meters. The other sensing device is multispectral capturing green, red, and reflected infrared bands at 20 x 20 meters (
Figure 2d-7). SPOT-5, which was launched in 2002, is much improved from the first four versions of SPOT satellites. SPOT-5 has a maximum ground resolution of 2.5 x 2.5 meters in both panchromatic mode and multispectral operation.
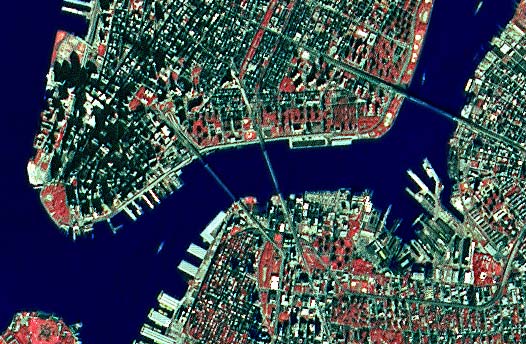
| Figure 2e-7: SPOT false-color image of the southern portion of Manhatten Island and part of Long Island, New York. The bridges on the image are (left to right): Brooklyn Bridge, Manhattan Bridge, and the Williamsburg Bridge. (Source: SPOT Image). |
Radarsat-1 was launched by the
Canadian Space Agency in November, 1995. As a remote sensing device, Radarsat is quite different from the Landsat and SPOT satellites. Radarsat is an
active remote sensing system that transmits and receives
microwave radiation. Landsat and SPOT sensors
passively measure reflected radiation at wavelengths roughly equivalent to those detected by our eyes. Radarsat's microwave energy penetrates clouds, rain, dust, or haze and produces images regardless of the Sun's illumination allowing it to image in darkness. Radarsat images have a resolution between 8 to 100 meters. This sensor has found important applications in crop monitoring, defence surveillance, disaster monitoring, geologic resource mapping, sea-ice mapping and monitoring, oil slick detection, and digital elevation modeling (
Figure 2e-8).
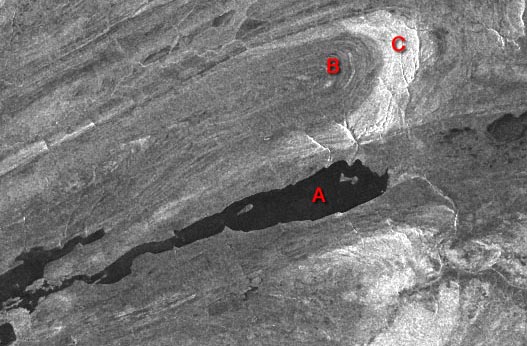
| Figure 2e-8: Radarsat image acquired on March 21, 1996, over Bathurst Island in Nunavut, Canada. This image shows Radarsat's ability to distinguish different types of bedrock. The light shades on this image (C) represent areas of limestone, while the darker regions (B) are composed of sedimentary siltstone. The very dark area marked A is Bracebridge Inlet which joins the Arctic ocean. (Source: Canadian Centre for Remote Sensing - Geological Mapping Bathurst Island, Nunavut, Canada March 21, 1996). |
Principles of Object Identification Most people have no problem identifying objects from photographs taken from an oblique angle. Such views are natural to the human eye and are part of our everyday experience. However, most remotely sensed images are taken from an overhead or vertical perspective and from distances quite removed from ground level. Both of these circumstances make the interpretation of natural and human-made objects somewhat difficult. In addition, images obtained from devices that receive and capture electromagnetic wavelengths outside human vision can present views that are quite unfamiliar. To overcome the potential difficulties involved in image recognition, professional image interpreters use a number of characteristics to help them identify remotely sensed objects. Some of these characteristics include:
Shape: this characteristic alone may serve to identify many objects. Examples include the long linear lines of highways, the intersecting runways of an airfield, the perfectly rectangular shape of buildings, or the recognizable shape of an outdoor baseball diamond (Figure 2e-9).
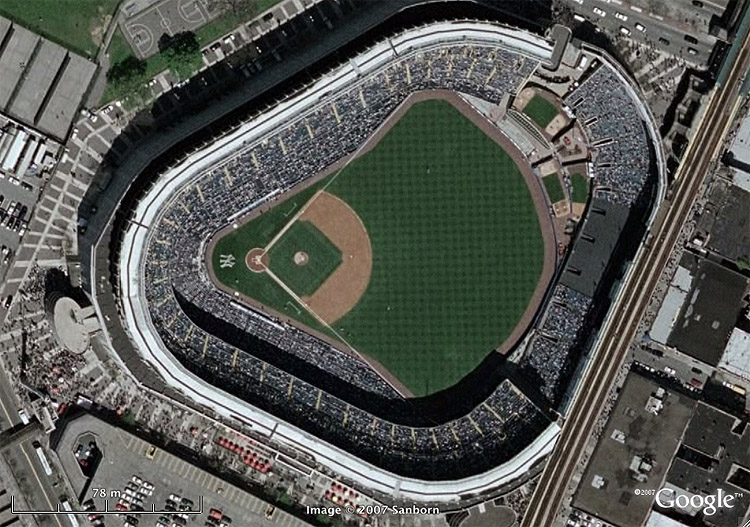
| Figure 2e-9: Yankee stadium in Bronx, New York. Baseball stadiums have an obvious shape that can be easily recognized even from vertical aerial photographs. (Source: Google Earth). |
Size: noting the relative and absolute sizes of objects is important in their identification. The scale of the image determines the absolute size of an object. As a result, it is very important to recognize the scale of the image to be analyzed.
Image Tone or Color: all objects reflect or emit specific signatures of electromagnetic radiation. In most cases, related types of objects emit or reflect similar wavelengths of radiation. Also, the types of recording device and recording media produce images that are reflective of their sensitivity to particular range of radiation. As a result, the interpreter must be aware of how the object being viewed will appear on the image examined. For example, on color infrared images vegetation has a color that ranges from pink to red rather than the usual tones of green.
Pattern: many objects arrange themselves in typical patterns. This is especially true of human-made phenomena. For example, orchards have a systematic arrangement imposed by a farmer, while natural vegetation usually has a random or chaotic pattern (Figure 2e-10).
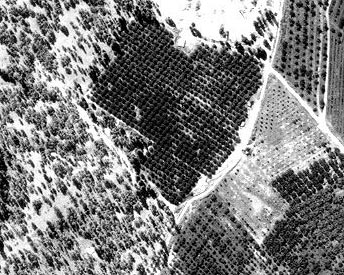
| Figure 2e-10: Black and white aerial photograph of natural coniferous vegetation (left) and adjacent apple orchards (center and right). |
Shadow: shadows can sometimes be used to get a different view of an object. For example, an overhead photograph of a towering smokestack or a radio transmission tower normally presents an identification problem. This difficulty can be over come by photographing these objects at Sun angles that cast shadows. These shadows then display the shape of the object on the ground. Shadows can also be a problem to interpreters because they often conceal things found on the Earth's surface
Texture: imaged objects display some degree of coarseness or smoothness. This characteristic can sometimes be useful in object interpretation. For example, we would normally expect to see textural differences when comparing an area of grass with a field corn. Texture, just like object size, is directly related to the scale of the image
GOOD LUCK FOR ALL
Mohamed Hassaan


ساحة النقاش